Our tasks
The 'Data Science and Analysis' unit of AMCRA is dedicated to the analysis and reporting of antibacterial use data in animals. The focus is currently on antibacterial use at farm level and in livestock (pigs, chickens, cattle).
In practice, antibacterial use registrations, collected in external data collection systems, are processed using a specific methodology to periodic benchmarking reports for farmers and veterinarians on the one hand and reports at sector or national level on the other hand.
Periodic benchmarking reports
These are aimed at individual farmers and veterinarians.
Benchmarking reports for farmers describe and benchmark the antibacterial use of a specific farm. The farmer and veterinarian(s) in question are provided with information about antibacterial use at the farm on the basis of the indicator TD100 (number of Treatment Days per 100 days). An essential aspect of this is the objective comparison with other farms or with threhold values (= benchmarking). The reports also contain qualitative information, for example regarding the use of different classes of antibacterials and on the importance of the antibacterials used for animal and public health indicated by the AMCRA colour codes.
Benchmarking reports for veterinarians provide information about the extent to which a veterinarian prescribes, purchases or administers antibiotics based on a score (the Veterinary Benchmark Score, VBS) that represents the extent to which the vet is involved, as a company vet or as a supplier of antibacterials, in farms with animal categories with a green, yellow or red benchmarking colour score. The VBS s a score out of 100, and the more yellow and/or red animal categories the vet is involved in, the lower his VBS will become. The veterinary benchmarking reports also contain qualitative information.
Reports at sector or national level
These reports describe, based on the data at farm level, the antibiotic use at national level (for example, in the Sanitel-Med Barometer or the BelVet-SAC reports), at the level of a specific sector or even for a group of farms associated with a particular quality scheme. These reports do not only describe the situation in the last year, but striking and/or important trends over longer periods are identified, monitored, and interpreted.
The analysis and reporting of antibacterial use plays an important role in achieving the objectives of AMCRA and its partners united in the Antibiotic-covenants and the Belgian National Action Plan on AMR. After all, "measuring is knowing": detailed information in the form of 'custom-made' reporting of antibacterial use at farm and sector level can be used in order to address and monitor (excessive) antibacterial use in a targeted way. The 'Data Science and Analysis' unit of AMCRA therefore plays a crucial role in communication to and awareness-raising among users and suppliers of antibacterials.
In addition to its core tasks of analysis and reporting, the 'Data Science and Analysis' unit also provides support and advice in the development and operation of the various data collection systems in Belgium concerned with antibacterial use in veterinary medicine, and it is involved in a number of (inter)national projects relating to quantification of antibacterial use in animals.
Clients
Currently, the 'Data Science and Analysis' unit of AMCRA is working on behalf of the Belgian Federal Agency for Medicines and Health Products, in the context of the national data collection via 'Sanitel-Med' for pigs, poultry (the complete 'lay' and 'meat' branche, plus turkeys) and bovines (dairy and meat cows, veal calves). In addition, the unit works on behalf of several private quality schemes, in the scope of the data collection via 'AB Register' and 'BIGAME', for pigs, poultry, dairy and meat cows in Flanders, and dairy and meat cows in Wallonia, respectively. There is also a collaboration with the Flemish Agency for Agriculture and Fisheries, related to the European subsidies for achieving a reduction in antibacterial use.


The indicator 'TD100'
Antibacterial use can be expressed in a few different ways. As a basic rule, a good 'indicator' consists of a numerator (= the number of 'technical units' used) that is standardised using a denominator (= the mass of animals).
The annual total quantity of antibacterials for animals sold in Belgium, for example, is reported in mg of active substance per kg of biomass. This is a 'weight-based' method of calculating antibacterial use, given that weight-based technical units (mg) are used.
Another method is determining the degree to which animals are exposed to antibacterial use. This method is based on determining the treatment incidence (Timmerman et al., 2006, Prev. Vet. Med., 74, p. 251-263). Calculating the TD100 is one example of this. The TD100 is the number of Treatment Days using antibacterials per 100 days. In other words, the % of treatment days with antibacterials. This is a 'dose-based' indicator, as the numerator consists of the 'number of doses used'.
THE PRINCIPLE OF CALCULATING THE TD100
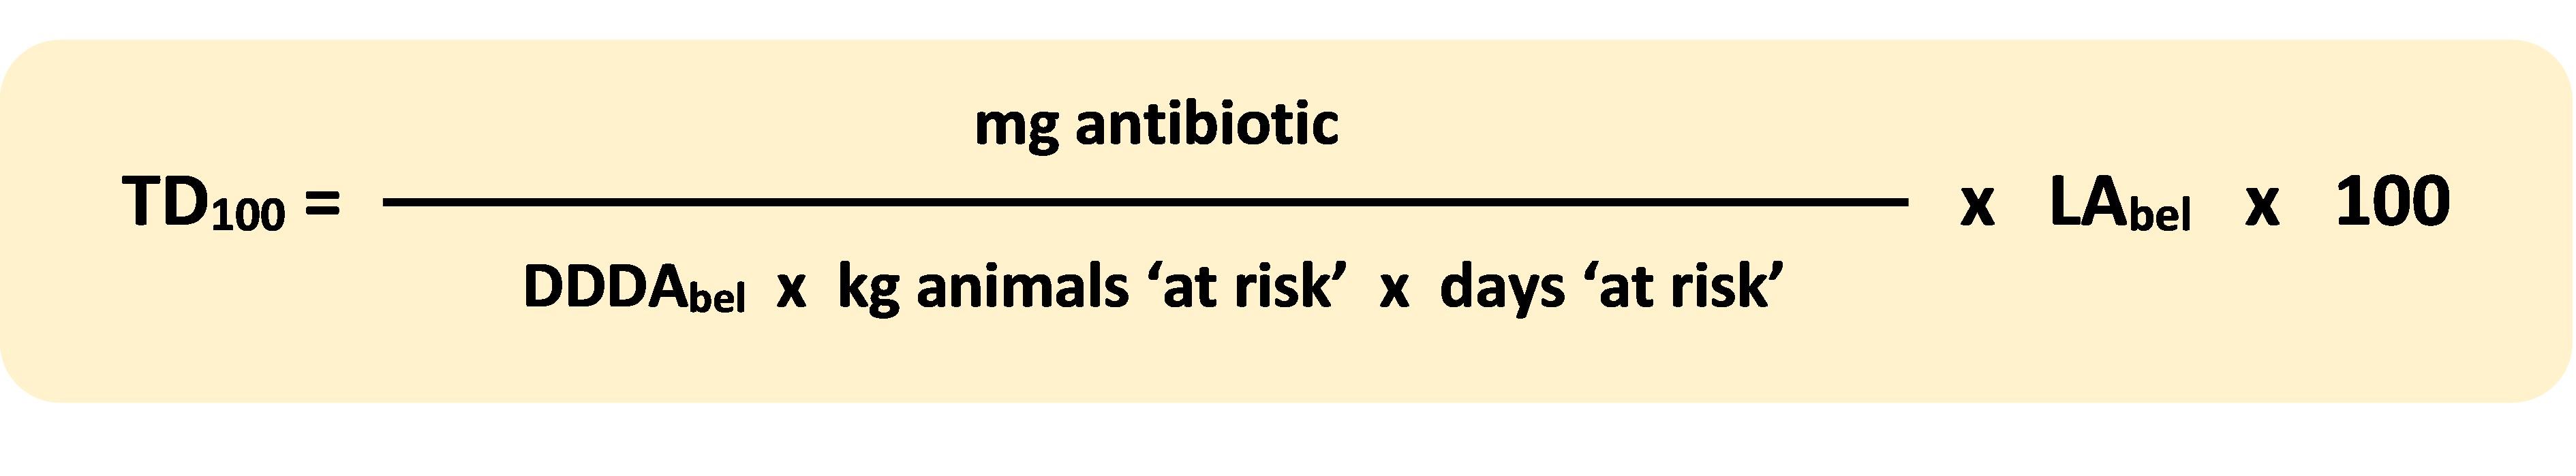
To calculate the TD100 the quantity of antibacterials used is divided by
- the DDDAbel or Defined Daily Dose Animal defined for Belgium (see further)
- the total mass of animals that was at risk of treatment (average number of animals present multiplied with the estimated mass at the time of treatment)
- the total number of days that an animal was at risk of treatment.
Some products have a longer duration of action. The LA-factor or 'Long Acting-factor' adjusts for this extended duration of action. Indeed, one day of treatment with a long-acting product must be counted as more than one treatment day.
The formula for calculating the TD100 is this:
THEREFORE:
Antibacterials for which the package leaflet recommends a low dose are weighted equally in the calculation with antibacterials for which a high dose is recommended.
AND: large farms are levelled to small farms.
AND ALSO: regardless of which period at risk is considered, the antibacterial use is converted to 100 days.
IN OTHER WORDS:
Antibacterial use is calculated in a standardised way for each farm, which allows for a valid comparison of farms.
DEFINED DAILY DOSE ANIMAL
Different dose-based 'technical units' exist for expressing the quantity of antibacterials used, such as the defined daily dose (DDD), the used daily dose (UDD), and the defined course dose (DCD), .... In order to distinguish between the units used in human medicine and those in veterinary medicine, we add an 'A' (for 'animal') to the acronyms when referring to animals.
To calculate the TD100, the Belgian DDDA is applied, the DDDAbel. These values are defined for each product, based on the information given in the 'summary of product characteristics'. The same applies for the LA-factors, the LAbel. Further information about the methodology used to define the DDDAbel and the LAbel can be found in the documents that are available for downloading below. A third document describes how the treatment duration is determined, which is relevant to determine a standard dose of a complete treatment (DCDbel). Finally, there is a brief description of the method used to establish a DDDAbel for products used in animal species for which these products are not authorised ('off label use').
The antibacterial dosing list for each species for which AMCRA is currently responsible for producing benchmarking reports (pigs, chickens, (veal) calves, cows) is available below. These include the DDDAbel and LAbel defined for all products. The antibacterial dosing lists are updated regularly. A list is also available for products used in animal species for which the products are not authorised but for which antibacterial registrations exist in Sanitel-Med ('off label use').
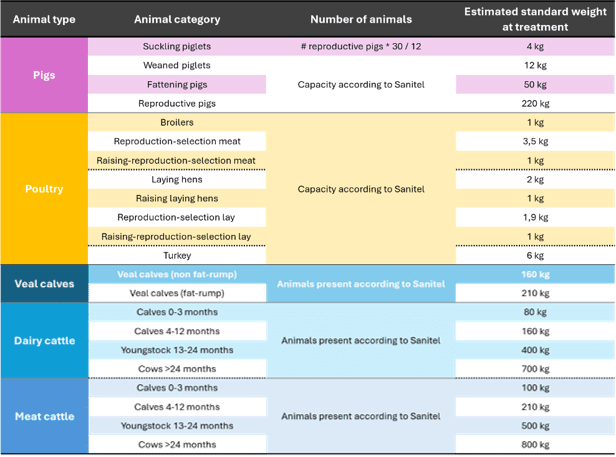
WEIGHTS USED PER ANIMAL CATEGORY
As the weight of the animals at the moment of treatment is not collected, an assumed weight at the time of treatment must be used. For pigs and broilers, standard weights are used that have been recommended by the European ESVAC project. For the other animal categories, weights are used that are determined in consultation with the sectors.
Benchmarking
FARMERS
All procedures applied by AMCRA with regard to calculating, checking and monitoring data quality, and to benchmarking and reporting antibacterial use in animals at farm level, based on data collected in Sanitel-Med, are summarized in a Standard Operating Procedure (current version July4, 2025 - in French). This includes an explanation of the calculation of the TD100, the animal numbers and standard weights used (see also above), and the method and parameters used for benchmarking and determining the benchmark color scores (see general principles below). Since publication of the Royal Decree of December 17, 2024, the AB-farm-statute has a legal meaning with possible consequences in the event of long-term high-volume use; the principles for determining the AB-farm-statute are summarized in a separate document (current version February 19, 2025 - in French).
Benchmarking of farmers is carried out by comparing their antibacterial use, specifically their average TD100 value during the benchmarking period, with one or two TD100 threshold values. This is done per animal category. The benchmarking period is one year (for pigs, poultry, and cattle) or two years (for veal calves). The result is a benchmark value (= average TD100) and a benchmark colour score according to a classification as a low user (green colour score), intermediate user (yellow colour score) or high user (red colour score).
In Belgium, in a first phase dynamic threshold values are applied: threshold values that change and are recalculated for each benchmarking report. Two threshold values are typically used: the TD100 value delineating the 10% highest users is the upper threshold value. The TD100 value delineating the 50% lowest users is the lower threshold value. Working with dynamic threshold values allows for an insight into how the sector is developing as a whole, while also identifying the farms with the highest antibacterial use in a representative way. The disadvantage of this method, however, is that farmers can never be sure what to expect in the next benchmarking report.
For this reason, in a second phase interval threshold values are applied. These threshold values are maintained for a longer period: the interval. The duration of the interval depends on the overall antibacterial use in the sector, the antibacterial use in other animal categories, and the threshold values themselves.
At present, dynamic threshold values are being used in milk and meat cattle and in some poultry categories.
The switch to interval threshold values is basically done once there is a sufficiently clear picture of (the evolution of) antibacterial use in a sector. This is already the case for the pig, broilers and laying hens, and veal calf sectors, whose antibacterial use has already been mapped out for several years now, and communication has been established with farmers and veterinarians in these sectors via the benchmarking reports. In these sectors (except the laying hens), the interval threshold values form part of the sector-specific reduction targets that were envisioned in the AMCRA 2024 plan and that were established in consultation with the sectors in late 2020.
The sector-specific reduction targets consist of the TD100 threshold values that came into effect on 1 January 2021 and gradually decreased over time. This creates a 'reduction path' for each sector, in which it is clear for all farmers what requirements must be met. The reduction paths are discussed regularly with the respective sectors in order to assess feasibility against the situation in practice.
It is also possible to perform benchmarking based on the AMCRA colour codes (yellow, orange or red) that are assigned to antibacterials (see second graph below).
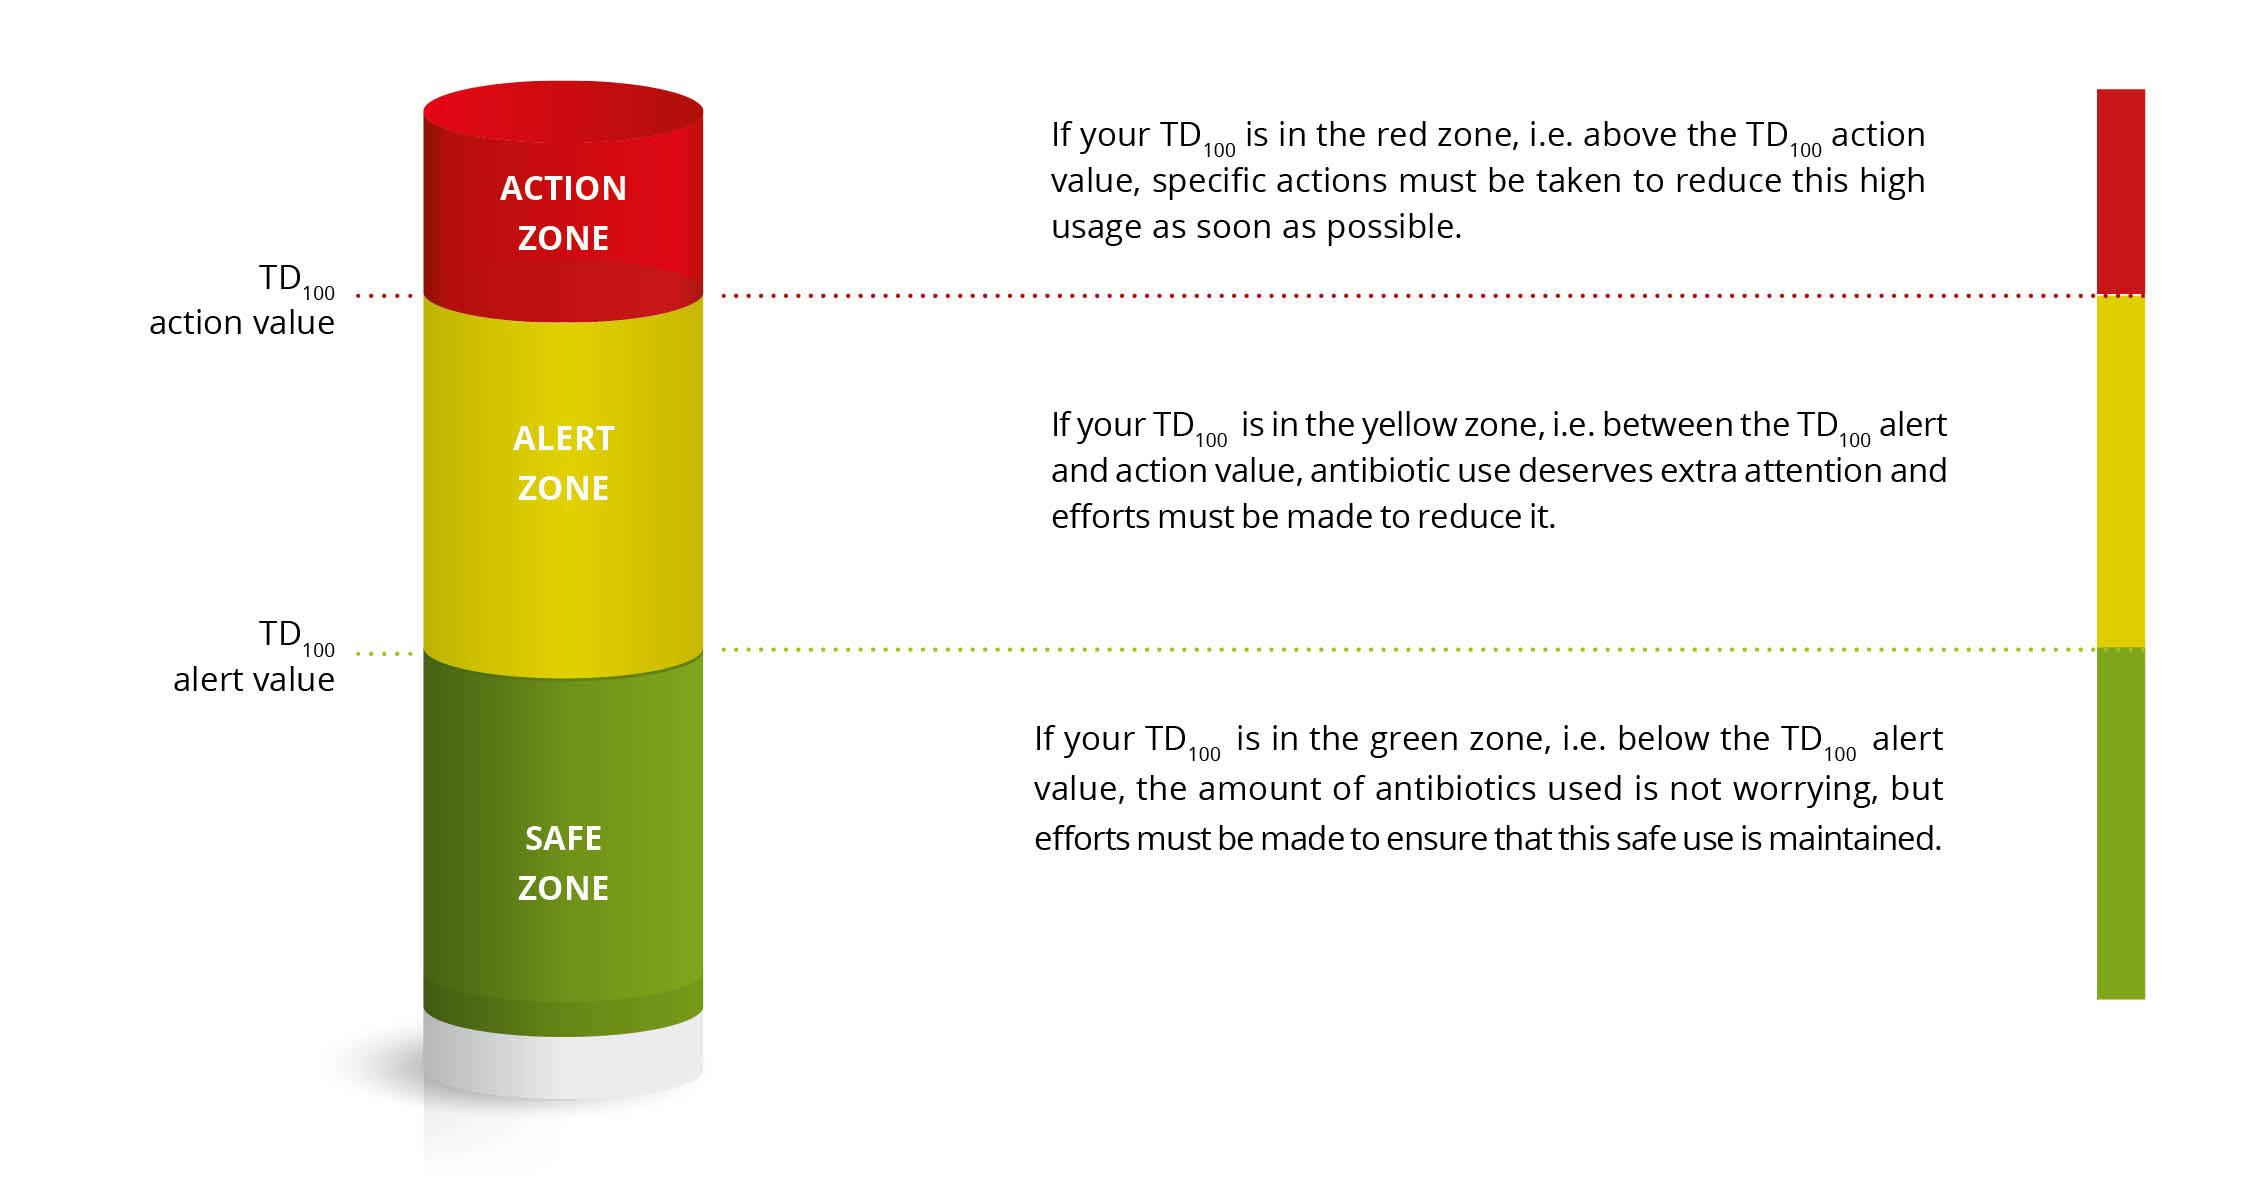
Figure: Principle of benchmarking using two threshold values.
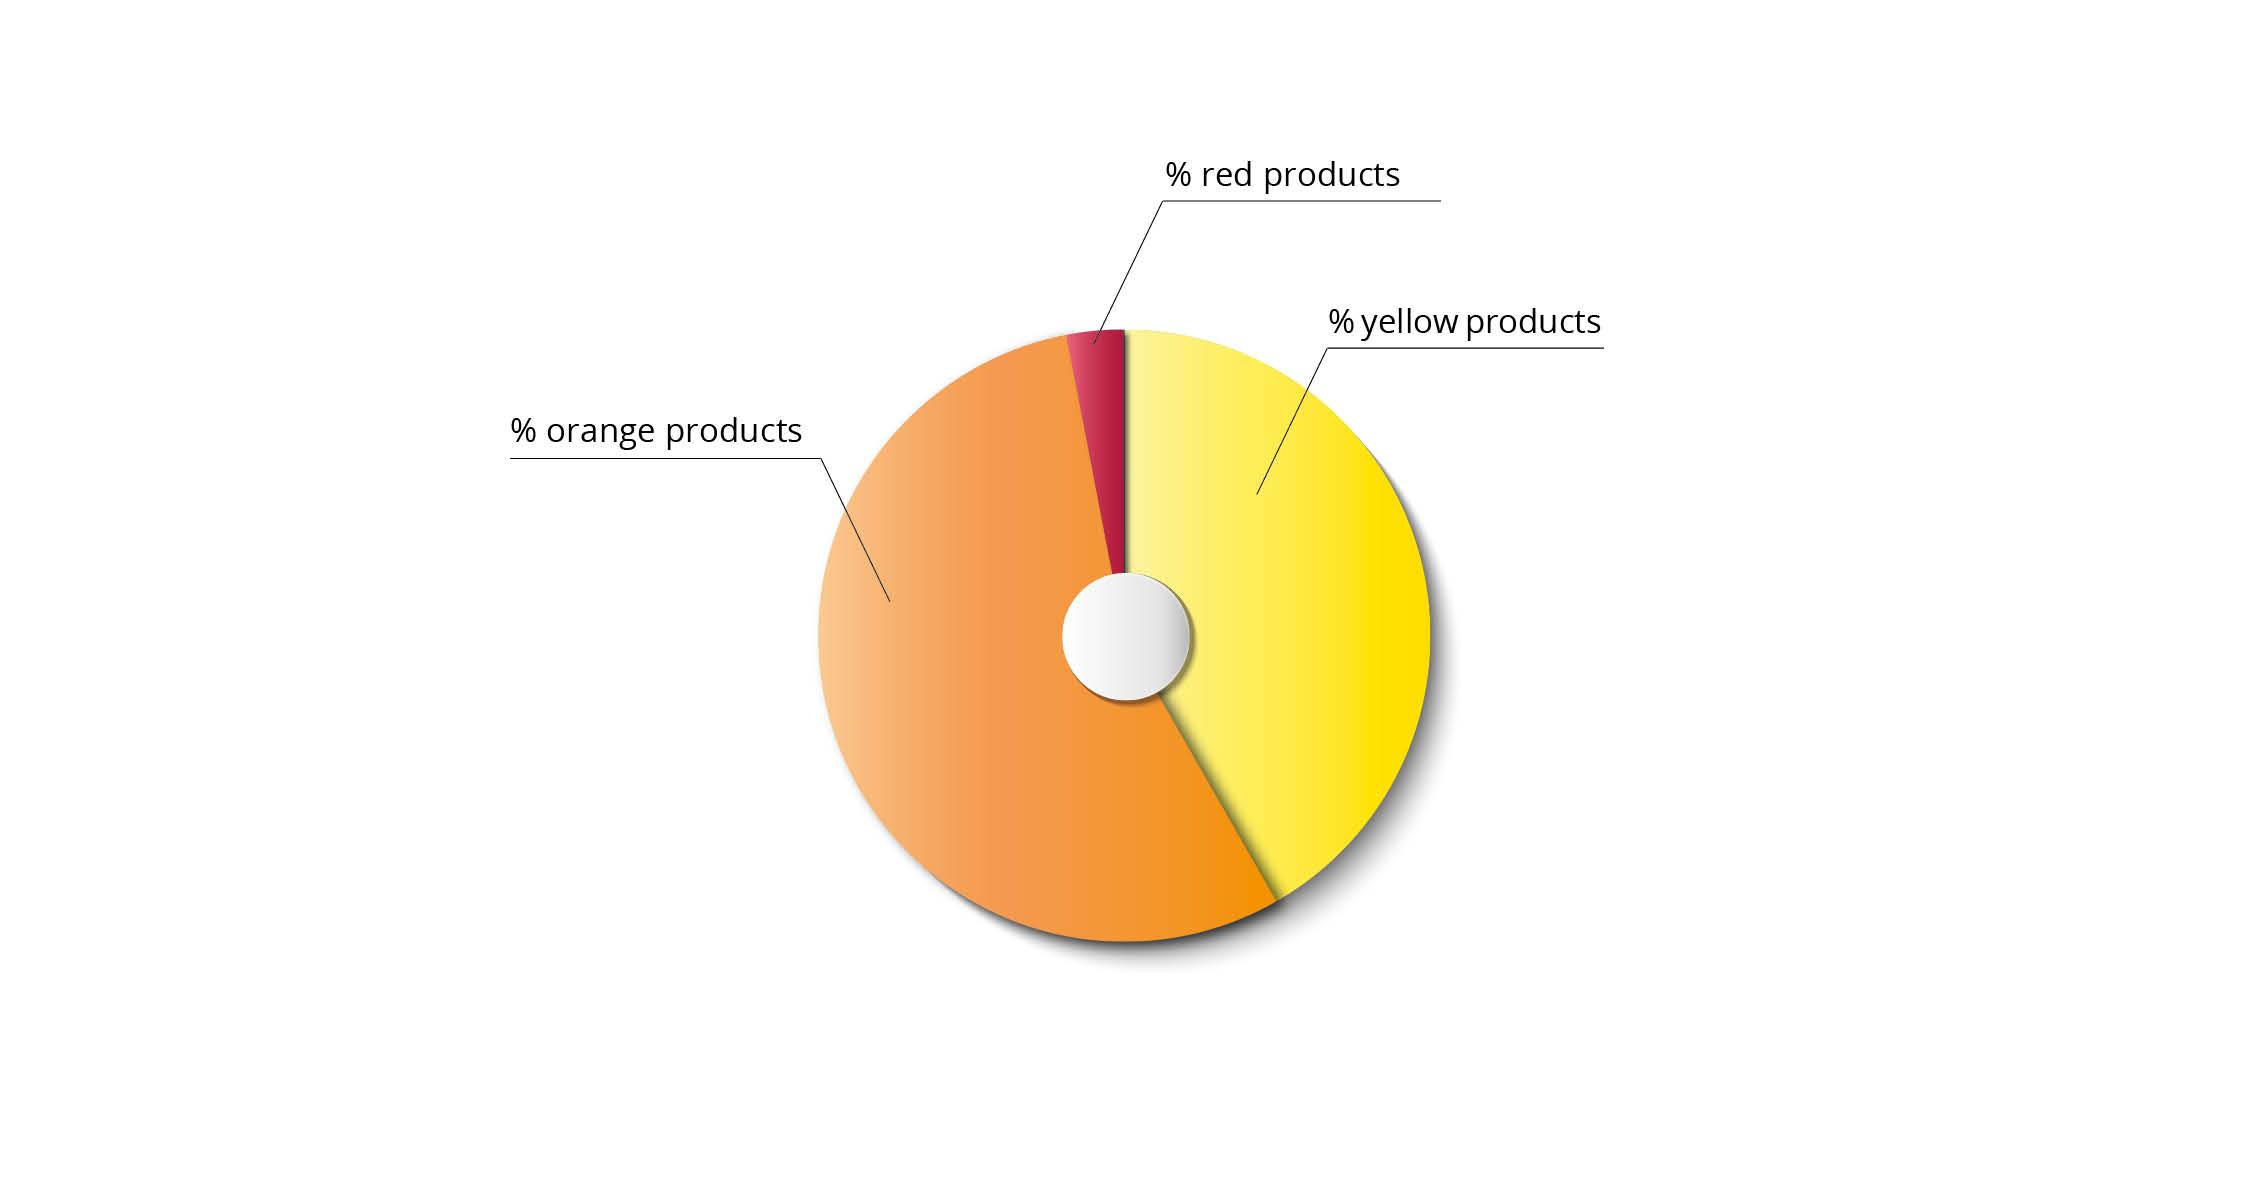
Figure: Example of a distribution of the number of treatment days by AMCRA colour codes of the used products.
VETERINARIANS
The methodology for benchmarking veterinarians is also described in a Standard Operating Procedure (current version September 8, 2025 - in French).
In practice, benchmarking is done using a Veterinary Benchmark Score (VBS), a figure out of 100 that reflects the benchmark results of a veterinarian's contract farms plus the non-contract farms where he provides antibacterials. A 'contract farm' is defined as a farm with which the veterinarian had a contract as a company veterinarian for at least half (= 183 days) of the benchmark period (= one year).
In concrete terms, the VBS reflects the extent to which a veterinarian contributes to green, yellow and red animal categories.
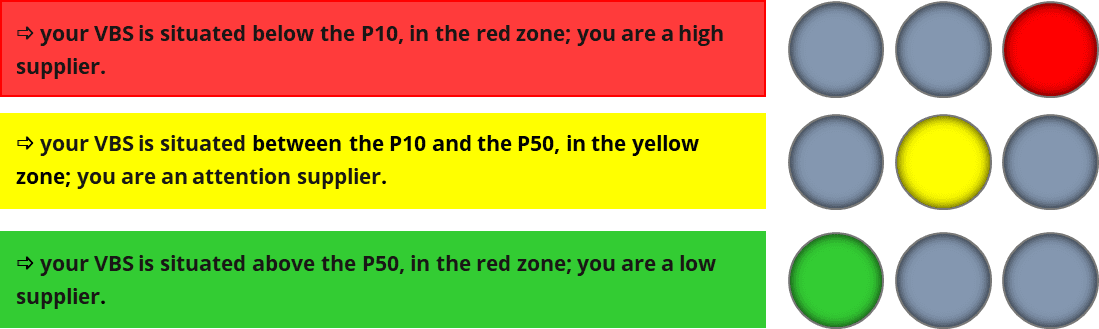
Figure: Benchmarking of veterinarians based on the Veterinary Benchmarking Score and two threshold values.
As for livestock farmers, two threshold values are determined for the VBS that divide veterinarians into 50% 'low suppliers', 40% 'attention suppliers' and 10% 'high suppliers'.
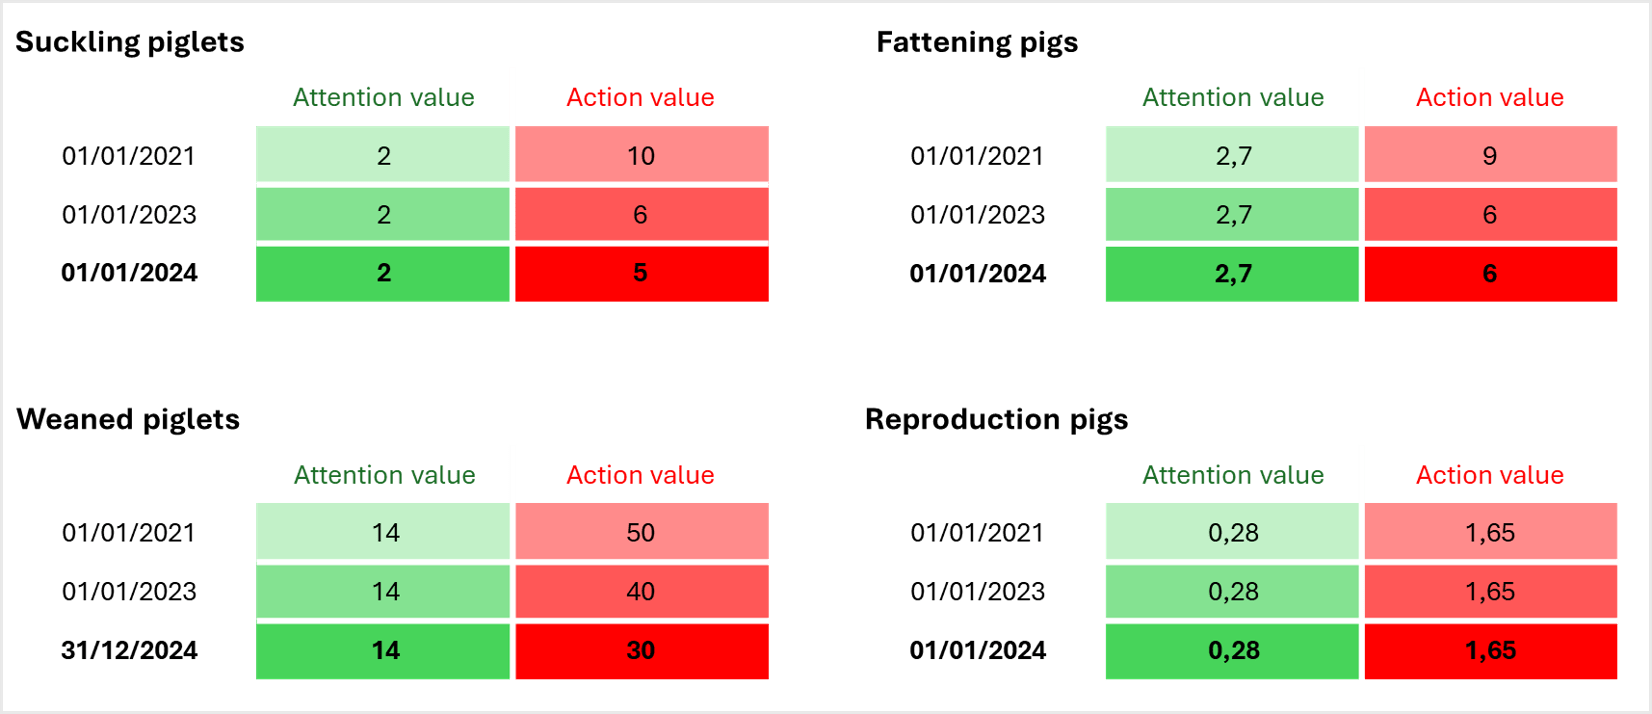
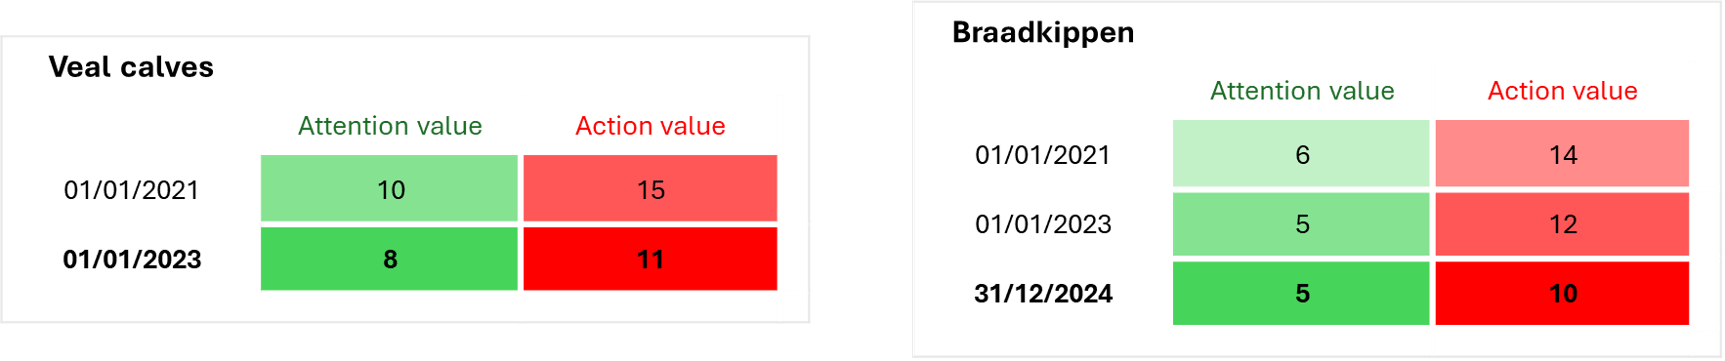
Sector-specific TD100 threshold values
Barometer Antibiotic Use
Every quarter, the FAMHP and AMCRA publish the 'Barometer Antibiotic Use', based on the mandatory registration of antibacterial use in Sanitel-Med. The Barometer allows showing a number of trends with regard to antibacterial use for the species pigs, poultry, veal calves, dairy and beef cattle: the evolution of the total use in each animal species in a period of a year (each time shifting by a quarter), both in tonnes and in BD100, with insight into the number of companies without antibacterial use; the use of a number of veterinary important antimicrobial families; and the share of companies per benchmark colour score and the number of tonnes of antibiotics used by the companies with these colour scores.